FireCrawl + Claude Code + Clay: How I Built a Trade Show Intelligence Dashboard Without Writing a Line of Code
A Clay workflow example showing how I used FireCrawl, Claude Code, and Clay to build a trade show intelligence dashboard. 21 events scored, 415 ICP companies identified, 1,333 contacts scraped.
Fractional Demand Team
Manually researching trade shows is one of those tasks that feels productive but is actually just slow. You're clicking through exhibitor lists. Reading speaker bios. Cross-referencing company names against your ICP in a spreadsheet. Multiply that by 20 events and you've burned a week before you've made a single decision.
I automated the entire thing using one of the most useful Clay workflow examples I've built to date. 21 events analyzed. 1,151 companies identified. 415 ICP matches scored. 1,333 contacts scraped. Built in a few hours.
Here's exactly how the pipeline works and which tool does what.
Why This Matters Right Now
Event budgets are getting scrutinized harder than ever. Marketing leaders can't walk into a planning meeting and say "we should go to this one because we went last year." The question has changed. It's not "is this event relevant to our space." It's "how many of our target accounts are actually going to be in the room, and which of our buyer personas can we get in front of?"
That's a data question. And most teams are answering it with gut feel and a Google search.
The Three Tools and What Each One Does
Here's the thing. Any one of these tools can do something useful on its own. FireCrawl can scrape a website. Clay can enrich a list. Claude Code can build a UI. The value is in connecting them into a pipeline where the output of each step feeds the next.
FireCrawl (via MCP in Claude Code) handles the scraping layer. I connected it through the MCP server and pointed it at each event website. For every event, it pulled the companies attending (exhibitors, sponsors, anyone listed), individuals mentioned (keynote speakers, panelists, session leads), their event role classification, and whatever context was available on session topics and company descriptions.
FireCrawl did the extraction. Claude Code orchestrated the logic and structured the raw scraped data into something usable.

Clay is the enrichment backbone. I fed the structured data into Clay tables and ran a four-step pipeline:
- ICP evaluation. An AI prompt looks at each company name and domain and returns a structured response: ICP fit (yes/no/unknown), inferred industry, confidence level, and disqualification reason if applicable.
- Persona matching. For every individual found at each event, I matched their title against the client's target buyer personas.
- Contact enrichment. For ICP-fit companies and matched personas, Clay pulled email addresses, LinkedIn profiles, and anything else useful for outreach.
- Outreach angle generation. This is the step most people skip and it's the one that actually books meetings. AI looks at the company profile, the event context, and the persona, then generates a specific reason to reach out. Not "we'll be at the same conference." An actual angle based on what that company does and why the client's product matters to them.
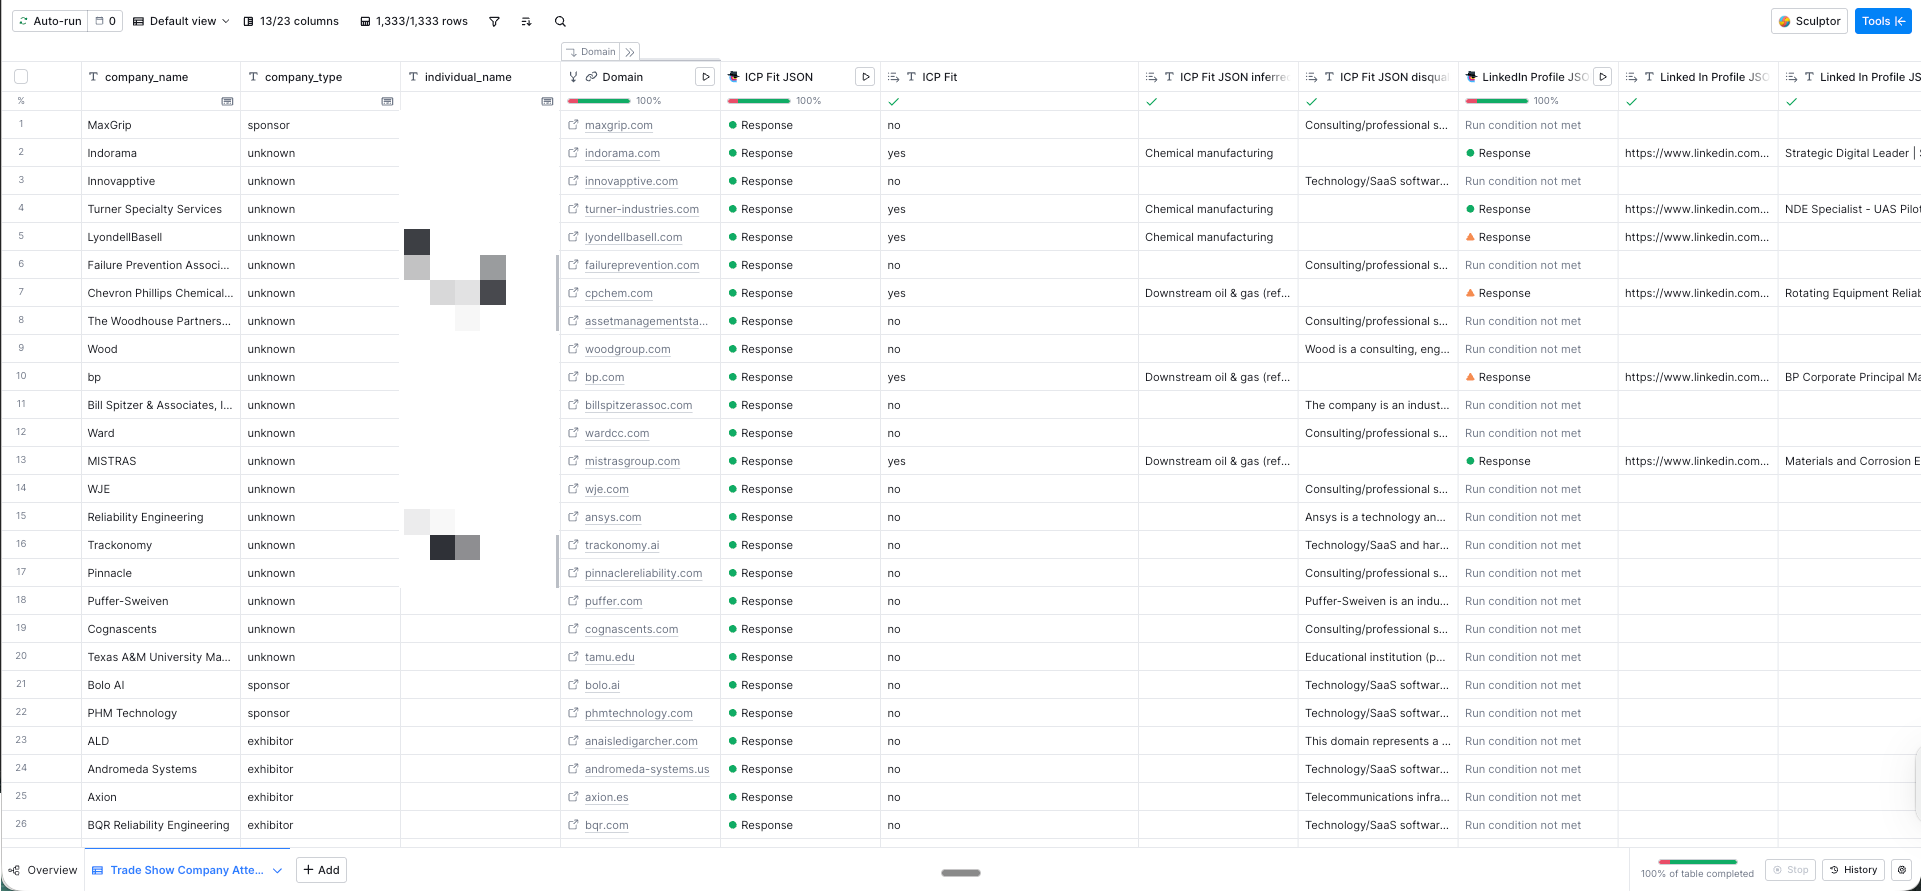 Clay table: 1,333 rows enriched with ICP fit, industry classification, and LinkedIn profile data.
Claude Code built the dashboard. Not a mockup. Not a wireframe. The actual interactive tool. It takes all the enriched, scored data and turns it into a decision layer. You can click into any event and see the companies attending, their ICP fit, their event role, industry classification, and the recommended outreach angle. You can drill into individual contacts. Filter by industry or persona. See which events rank highest by ICP density.
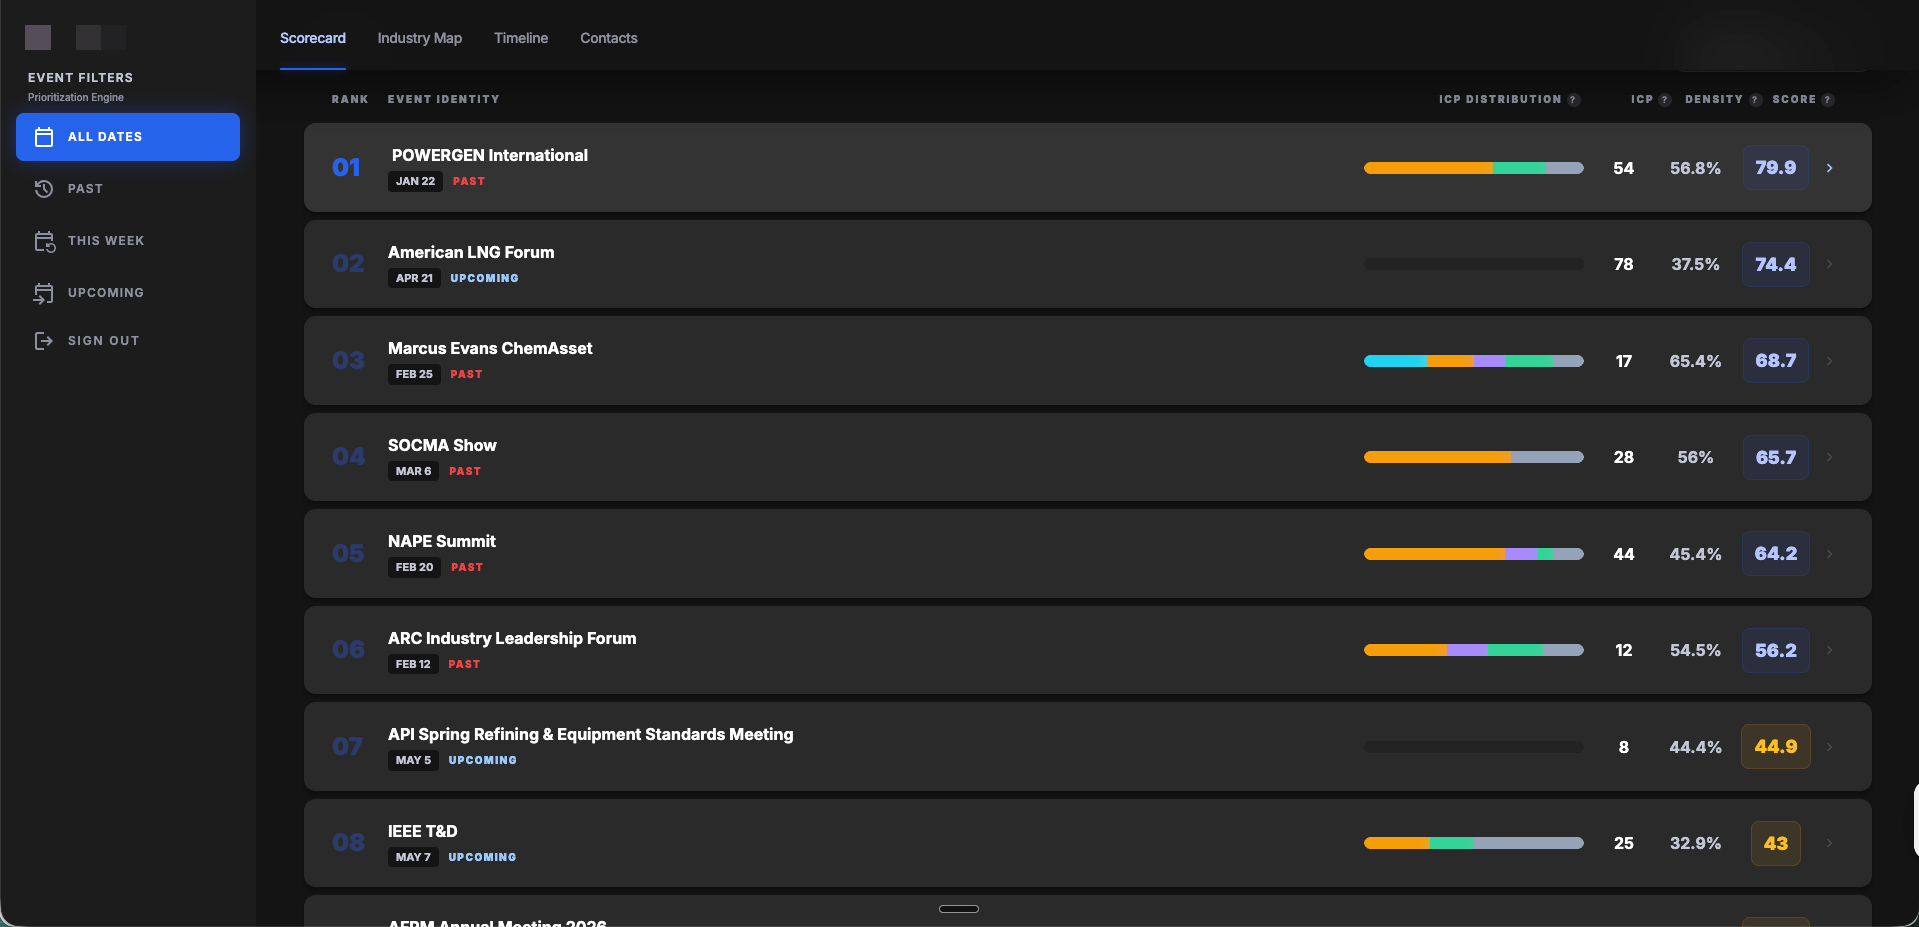 Events ranked by ICP density score — filter by past, upcoming, or all dates.
The Numbers
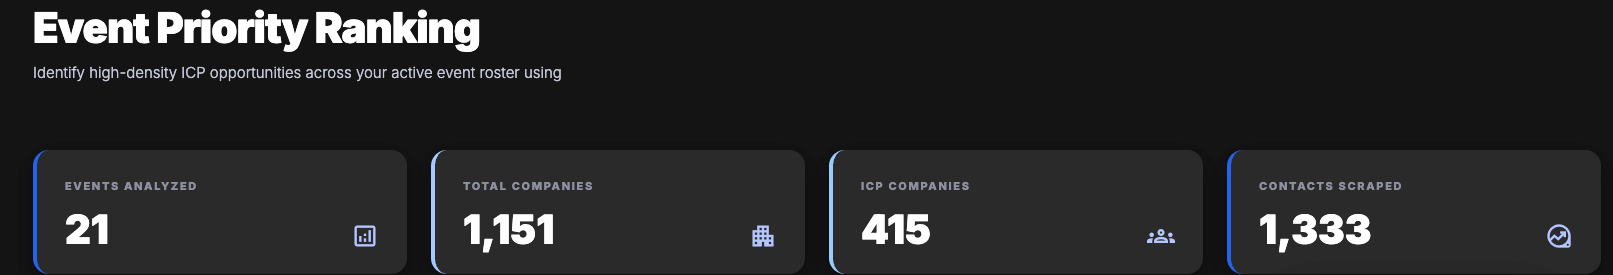
21 events analyzed. 1,151 total companies identified across all events. 415 of those companies matched the client's ICP. 1,333 individual contacts scraped and enriched.
A few hours of build time. Versus what would have been a week (minimum) of manual research that still wouldn't have produced a scored, ranked, interactive output.
The Part Nobody Talks About: Past Events Still Have Value
One thing I built into the dashboard is a timeline layer. Events are tagged by timing: already happened, coming up, or future. Each bucket gets contextual guidance.
Upcoming events get pre-event outreach recommendations. Book meetings. Schedule dinners. Set up demos.
But past events? That data isn't dead. "Noticed you were at [Event]. Seems like [relevant topic] was a big theme. We're working on exactly that problem." Still a warm outreach angle. And the scoring data tells you where to invest next year. Budget allocation backed by data.
How to Build a Clay Workflow Like This
Start with FireCrawl + Claude Code for the scraping. The MCP connection makes it easy to orchestrate multi-page scrapes with AI directing the extraction logic. You don't need to write code. You need to tell it what to look for.
Use Clay for everything enrichment. ICP scoring, persona matching, contact data, outreach angles. That's what Clay was built for and it handles the whole middle of the pipeline.
Then use Claude Code to build the output layer. Whether that's a dashboard, a report, or a simple scored spreadsheet. The point is: don't let the enriched data sit in a table. Turn it into something someone can actually make a decision with.
The whole pipeline took a few hours. The client walked into their next planning meeting with a ranked list of events, the accounts that matter at each one, and a specific outreach angle for every company. That's a different conversation than "I think we should go to this one."
If you're spending more than a day manually researching which events to attend, you're doing it wrong. We build systems like this for clients at Fractional Demand. If you want to see what this looks like for your ICP and your event calendar, let's talk.
This post is part of our series on B2B demand generation strategy and building scalable systems that drive pipeline. If you're looking for more ways to use AI in your outreach, check out our Teach Me in 10 on AI-powered email personalization.

