How to Build a Multi-Touch Attribution Model in Excel (No Tool Required)
Luke Spiker built a multi-touch attribution model in Excel in under an hour. No HockeyStack, no six-figure platform. The full walkthrough, with screenshots.
Fractional Demand Team
Most marketing teams have one field doing all the work. Lead source. A form fills it in, tags the lead "demo request," and every report you ever pull traces back to that single moment. That's last-touch attribution. It's the version of the truth most companies quietly live with, and it's leaving a lot on the table.
So I had Luke Spiker on Teach Me in 10 to fix it. Luke runs sales operations at NetStock, and in his words, "if there's one thing I'm passionate about in all of my life, it's multi-touch attribution." Then he did the thing almost nobody does on a podcast. He shared his screen and built a working multi-touch attribution model in Excel, live, in about the time it takes to grab lunch. No new tool. No budget request. No data team.
Here's the whole build, step by step.
Why last touch quietly costs you
Last touch wins by default because it's the lowest-hanging fruit. As Luke put it, "the lead source says demo request, so everything gets labeled demo request. We don't know if that demo request came through a paid ad or a webinar or an event. We just know it's a demo request, and that gets all the attribution."
That's fine until you sit down for annual planning. If every dollar of credit lands on the last touch, you have no idea what actually pulled people in the first time. Your top of funnel could be doing the heavy lifting and getting none of the budget. You end up optimizing for the finish line and starving the start.
Attribution is never going to be 100%. There's the dark funnel, the touches you can't track, all of it. The point isn't perfection. The point is a fuller picture than one field can give you.
Step 1: It's really just a join
You pull the native objects you already have in Salesforce or HubSpot: accounts, contacts, campaigns, campaign members, and opportunities. The whole game is joining your campaign members to your opportunities so each deal can see every interaction that touched it.
Luke does it in Power Query, which is native to Excel (no plugin). Data tab, get data, point it at the same workbook, pick campaign members and opportunities, then run a full outer join on account ID.
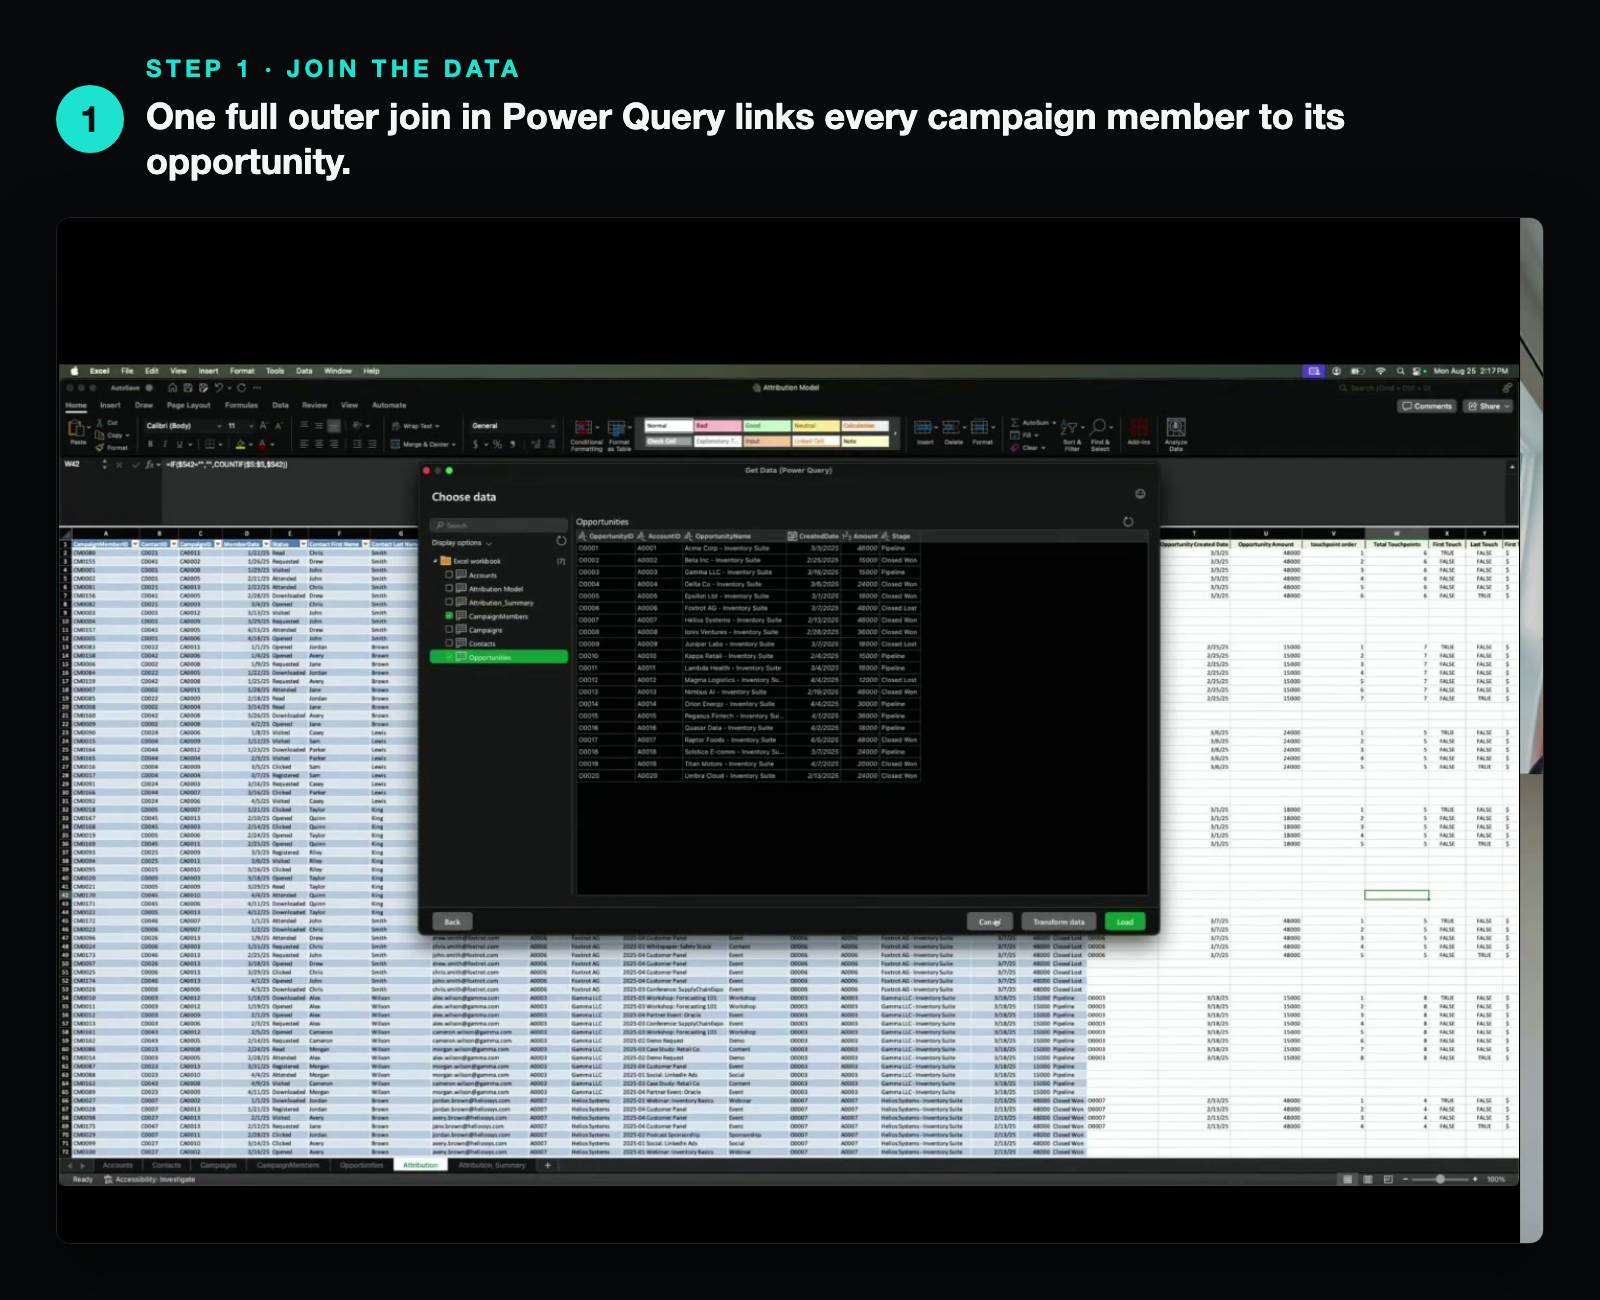
Now every opportunity is sitting next to all the campaign members on its account.
Step 2: Count the touches
Once it's joined, you sort by member date ascending, then by account. That groups every account together with its touches in date order.
Then one rule does the heavy lifting: only count a touch if it happened on or before the date the opportunity was created. A campaign member that shows up after the deal already existed didn't influence it, so it doesn't get credit. You write a quick formula to order the valid touches (1, 2, 3, and so on) and another to total them up.
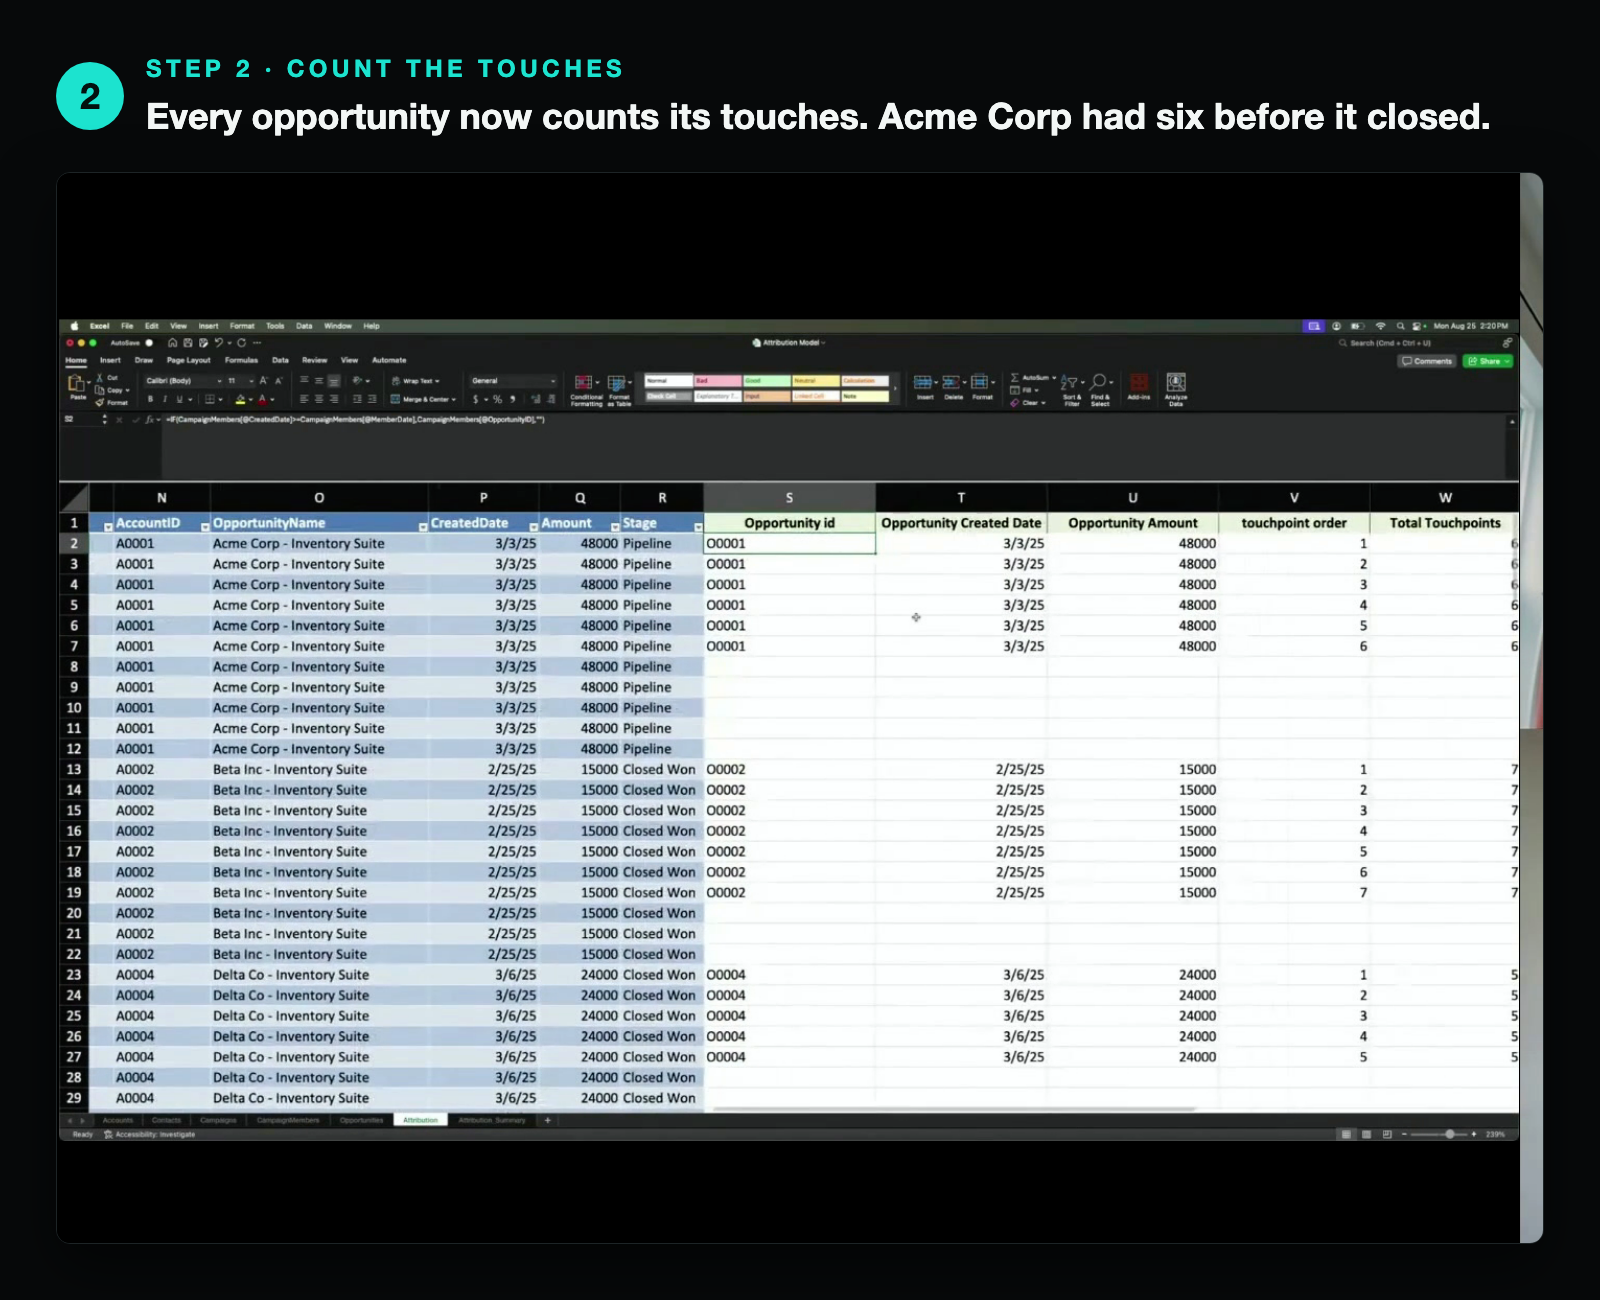
Now you can see it plainly. This opportunity had six touches. That's the whole reason you need multi-touch in the first place.
Step 3: Split the credit four ways
With touches counted and ordered, the models are just different ways to divide the opportunity amount. Luke walked through four:
- First touch: the very first interaction gets 100% of the credit.
- Last touch: the final converting touch gets it all. This is what you're already seeing in your lead source field.
- Linear: split the credit evenly across every touch.
- U-shape: 40% to the first touch, 40% to the last, and the remaining 20% split across everything in the middle.
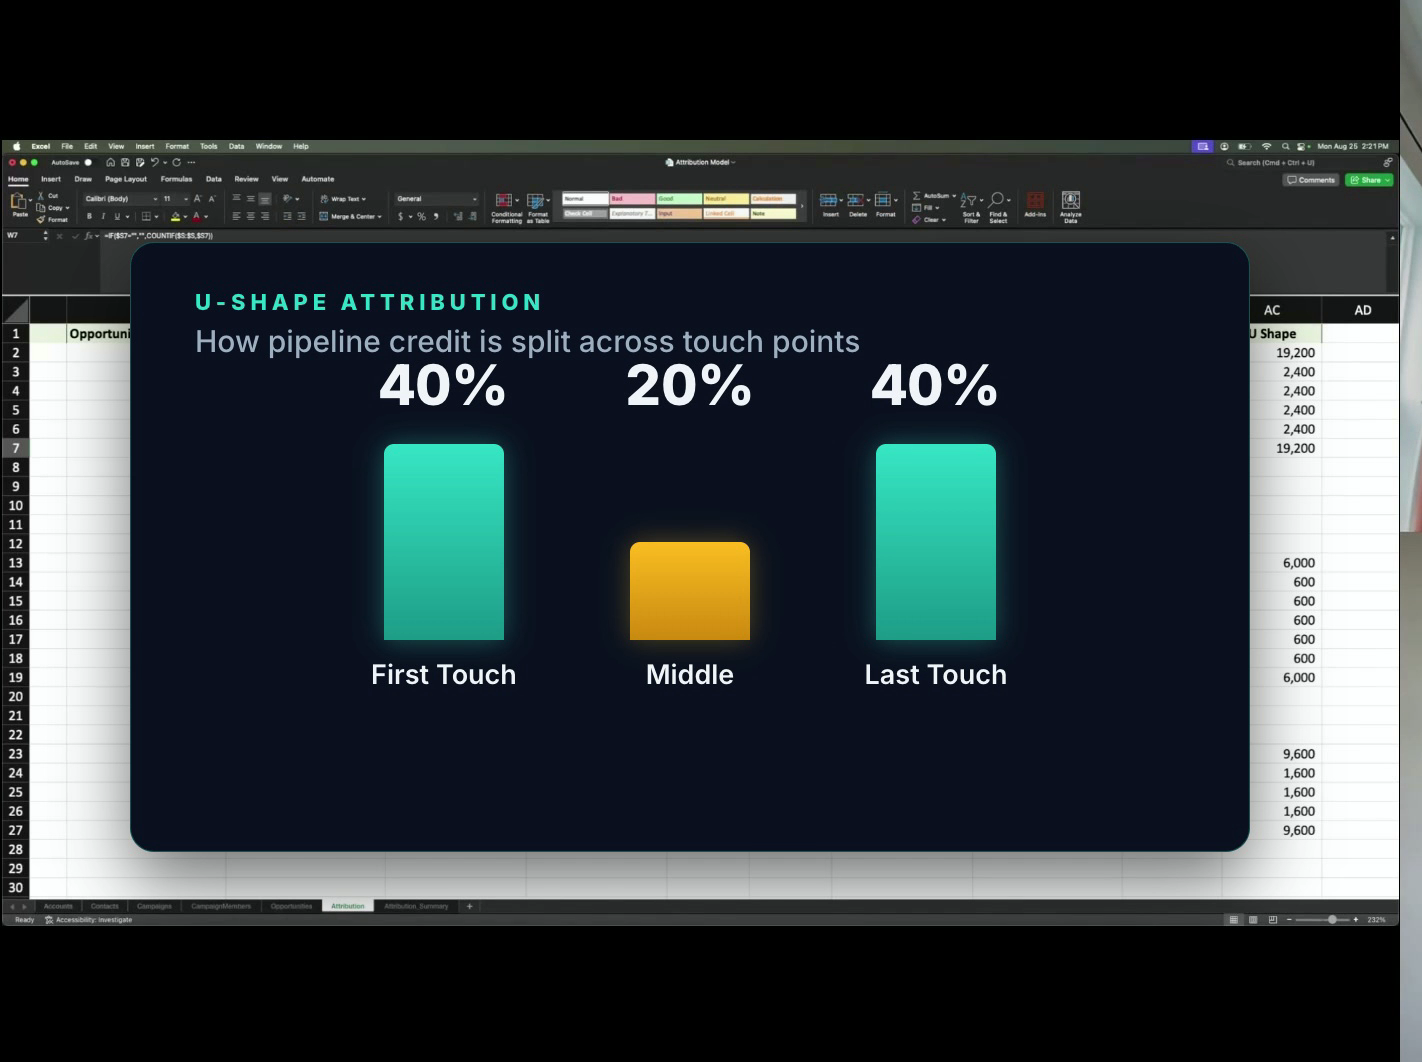 U-shape: 40% to the first touch, 40% to the last, 20% shared across the middle.
U-shape flexes with the number of touches. Two touches? 50/50. One touch? 100%. Three touches? 40/20/40. On a six-touch, $9,600 deal, the first and last each take 40%, and the four middle touches split the remaining 20%, so each one gets about $2,400.
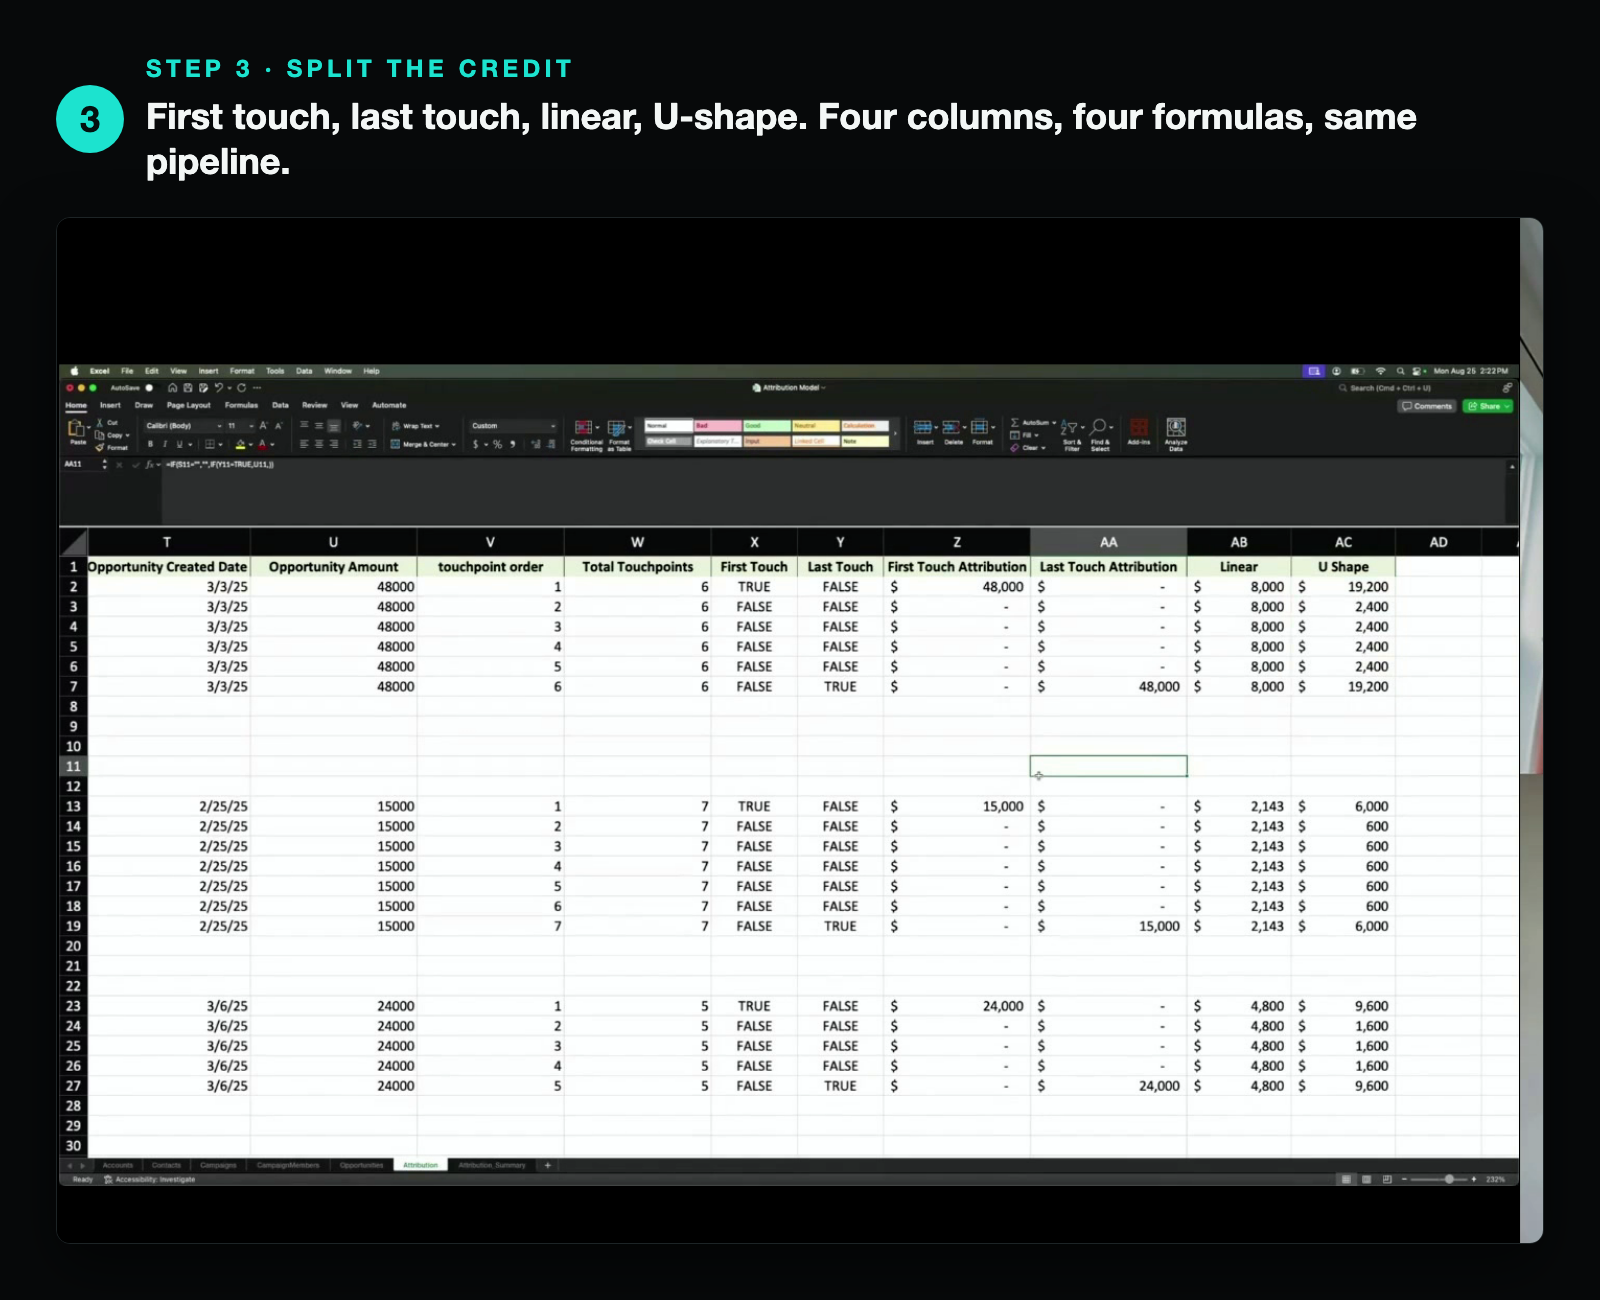
The nice gut check: every model reconciles back to the same pipeline total. First touch totals $48k, last touch $40k, linear $48k, U-shape $48k. Same deals, sliced four different ways.
And if you're worried about writing those formulas, don't be. Luke's take: "ChatGPT wrote 90% of the formulas in this. It spit out exactly what I needed." You describe the logic, it hands you the formula. That's why a build like this is 30 to 45 minutes now instead of an afternoon.
Step 4: Now you can talk to finance
This is where it stops being a spreadsheet exercise and turns into something you can put in front of finance. Pull in your campaigns and what you spent on each, then roll the credit up by channel.
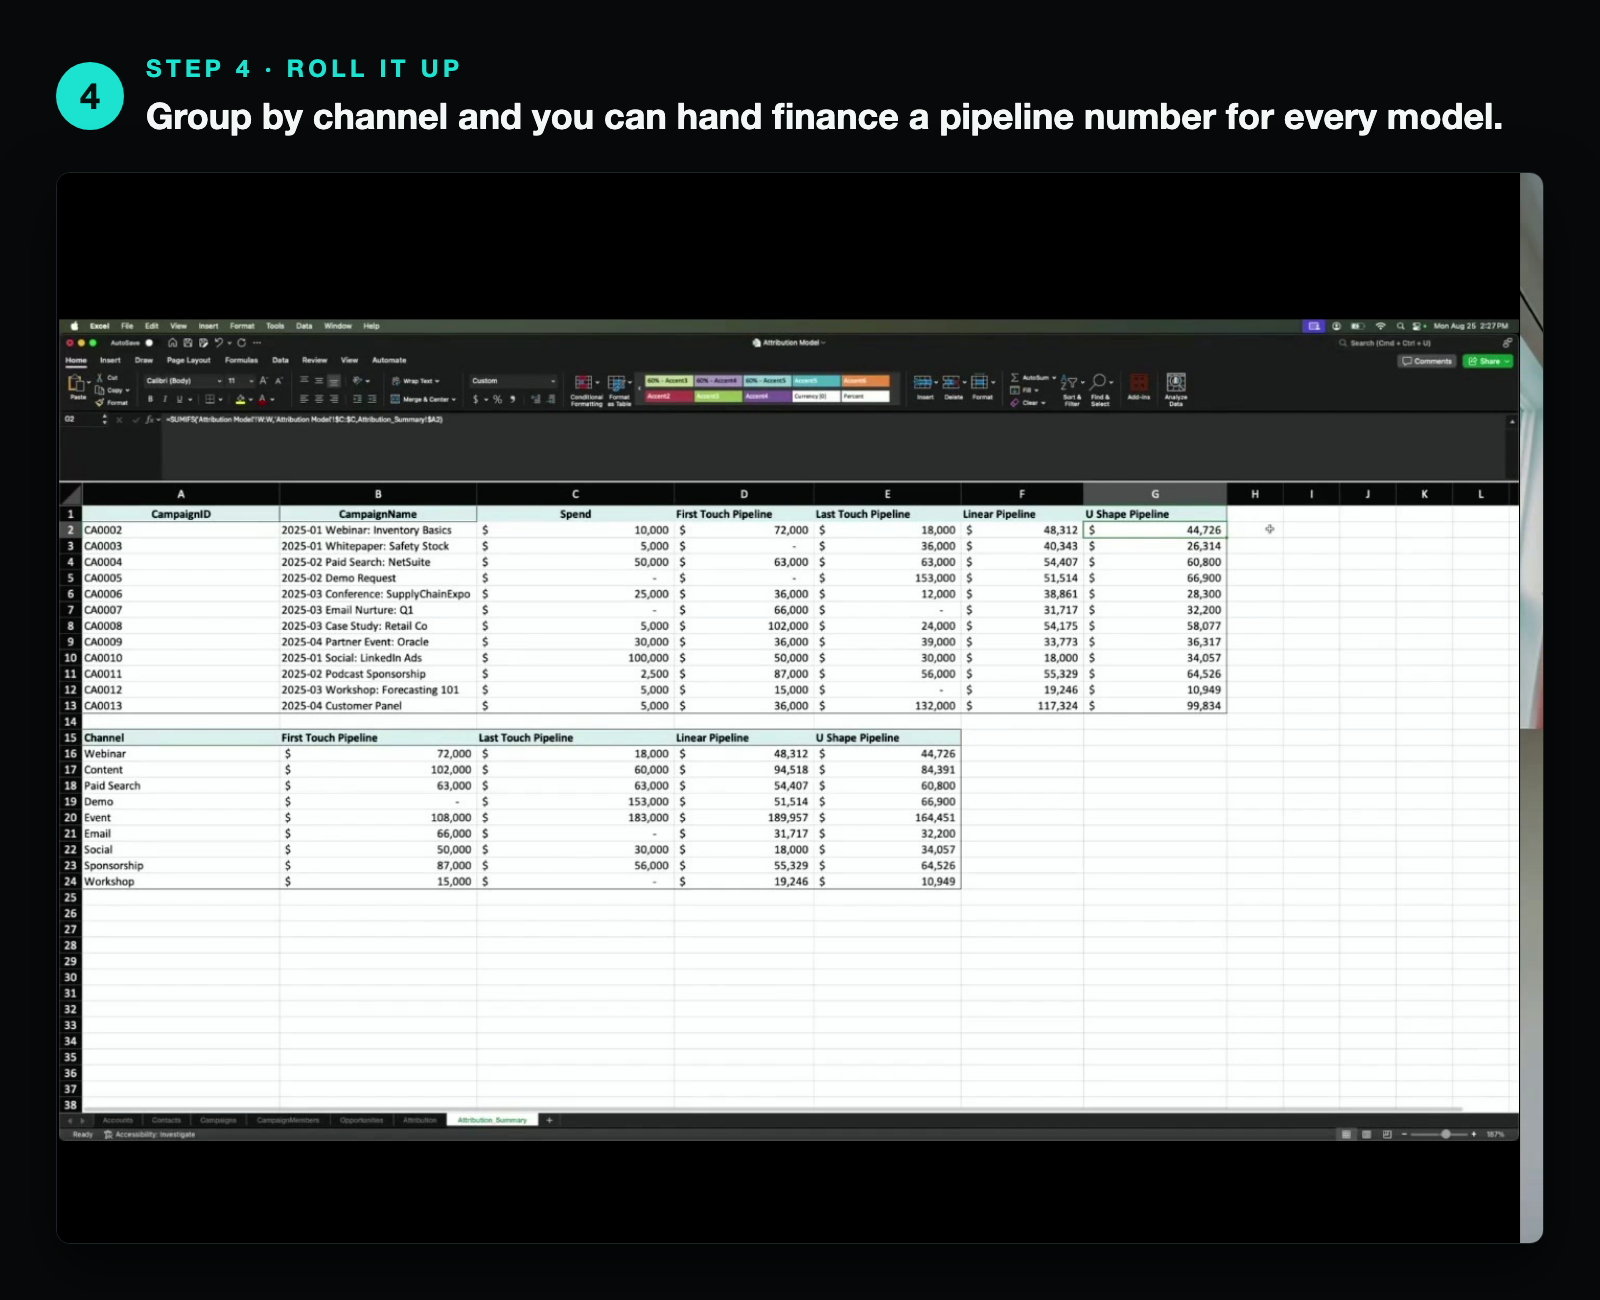
Luke's example: you spend $10k on a webinar. Your U-shape model says it drove $44k in pipeline. You've got a 50% win rate, so that's roughly $22k in closed-won ARR off a $10k spend. Now walk into the budget conversation. Instead of "trust me, webinars work," you put the spreadsheet on the screen and ask for more. That's a number finance can actually act on.
Is the juice worth the squeeze?
Changing how a company looks at attribution is part technical, part political. If everyone's used to the last-touch report, asking for a new view feels like picking a fight.
Luke's answer was a flat yes. You'll never get to 100%, but a model that shows what's generating pipeline beats a single field that only shows the finish line. If you only look at last touch, your team might be quietly struggling to drive new leads and not even know why, because you can't see what's bringing people in the first time.
When it actually makes sense to buy a tool
I asked the obvious follow-up. At what point do you stop doing this in Excel and go buy HockeyStack or Bizible?
Luke's read: simple BI tools get you about 80% of the way. Excel, Tableau, Domo, HubSpot, whatever you've got. The expensive platforms earn their keep on the last 20%, the stuff you genuinely can't do yourself, like crediting people who saw an ad without clicking it. If you're a large org that needs to optimize at that level, spend the money. If you're under that bar, the spreadsheet covers the majority of it.
In other words, don't buy the $100k tool to answer a question a free afternoon in Excel can answer.
If you only remember three things
- Last touch is a starting line, not the answer. It's easy, but it hides what's actually filling your funnel.
- You can build real multi-touch attribution in Excel in under an hour. It's one join, a couple of formulas, and ChatGPT for the syntax.
- U-shape is the sweet spot for most teams. Across thousands of touches, the models converge anyway, so pick the one that's simple and fast. U-shape is it.
Want the full walkthrough? Watch the Teach Me in 10 episode with Luke for the live build.
And if your marketing data feels messier than it should, that's the kind of thing we help teams untangle at Fractional Demand. Book a call and we'll take a look at where you're at.